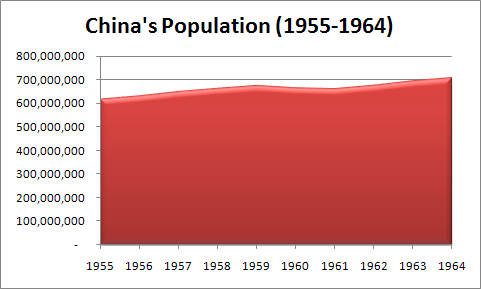
38,000,000 people dying in a four-year period is hard to fathom, but that’s how many starved to death in China from 1958-1961 during the Great Leap Forward. ((Jung Chang and Jon Halliday, Mao: The Unknown Story (New York: Alfred A. Knopf, 2005), 438.)) This does not even include 10,729,000 that died in labor camps, were executed, or were targeted minorities. ((R. J. Rummel, China’s Bloody Century: Genocide and Mass Murder Since 1900 (New Brunswick: Transaction Publishers, 1991), 247.)) A population chart is a great aid to better visualize how destructive this period was for the people of China. The chart below shows the population size moving up and down throughout the years, but it is not the best view.

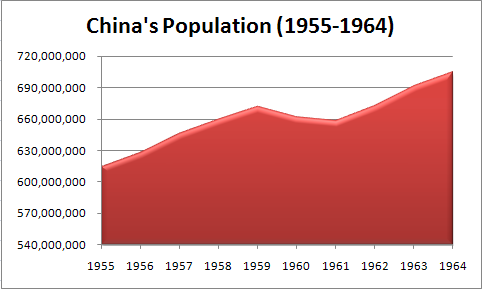
A slight dip is seen in the chart above. When dealing with hundreds of millions, the numbers become almost meaningless to the human mind. A clearer picture develops by zooming in on the chart and displaying a range of 180,000,000. China’s population was steadily increasing up to 1959 and then took a dip over the next three years until it began to steadily increase again.

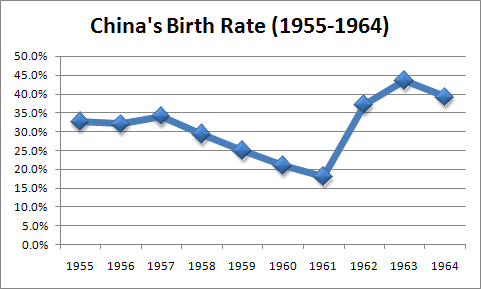
However, this dip is not simply accounted for by the deaths of nearly 49,000,000 million people. This period was marked by a decrease in the average calorie intake. As a result, the birth rate also decreased. From 1957 to 1961, the birth rate went from 34% to 18%. ((Basil Ashton et. al., “Famine in China, 1958-61,” Population and Development Review 10.4 (1984): 615.))

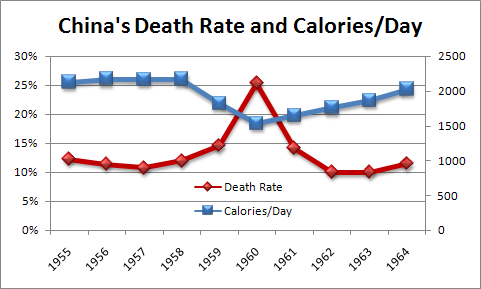
The chart below shows how the death rate was directly affected by the average calorie intake. As the calorie intake decreased, the death rate increased. The strongest change occurred in 1961 when when the average calories/day intake was just over 1,500 and the death rate peaked at 25.4%. ((Basil Ashton et. al. 1984, 615, 622.))

Appendix
The following table provides the raw data for China’s population, birth rate, death rate, and daily calorie intake from 1955-1964. ((Basil Ashton et. al. 1984, 615, 622.))
| Year | Population | Birth Rate | Death Rate | Calories/Day |
|---|---|---|---|---|
| 1955 | 614,700,000 | 32.60% | 12.30% | 2130.5 |
| 1956 | 628,300,000 | 31.90% | 11.40% | 2175.6 |
| 1957 | 646,500,000 | 34.00% | 10.80% | 2167 |
| 1958 | 659,900,000 | 29.20% | 12.00% | 2169.6 |
| 1959 | 672,100,000 | 24.80% | 14.60% | 1820.2 |
| 1960 | 662,100,000 | 20.90% | 25.40% | 1534.8 |
| 1961 | 658,600,000 | 18.00% | 14.20% | 1650.5 |
| 1962 | 672,900,000 | 37.00% | 10.00% | 1761.2 |
| 1963 | 691,700,000 | 43.40% | 10.00% | 1863.7 |
| 1964 | 705,000,000 | 39.10% | 11.50% | 2026.1 |
Bibliography
Ashton, Basil, Kenneth Hill, Alan Piazza, and Robin Zeitz. “Famine in China, 1958-61.” Population and Development Review 10.4 (1984): 613-645.
Chang, Jung, and Jon Halliday. Mao: The Unknown Story. New York: Alfred A. Knopf, 2005.
Rummel, R. J. China’s Bloody Century: Genocide and Mass Murder Since 1900. New Brunswick: Transaction Publishers, 1991.
